Advertising Spending by Global Brands: Big Tech Cuts Back, Consumer Spending Rises
On average, the largest brands spend a smaller portion of their revenue on advertising. This is shown in the new report from WARC Media. Consumer goods companies are bucking the trend.


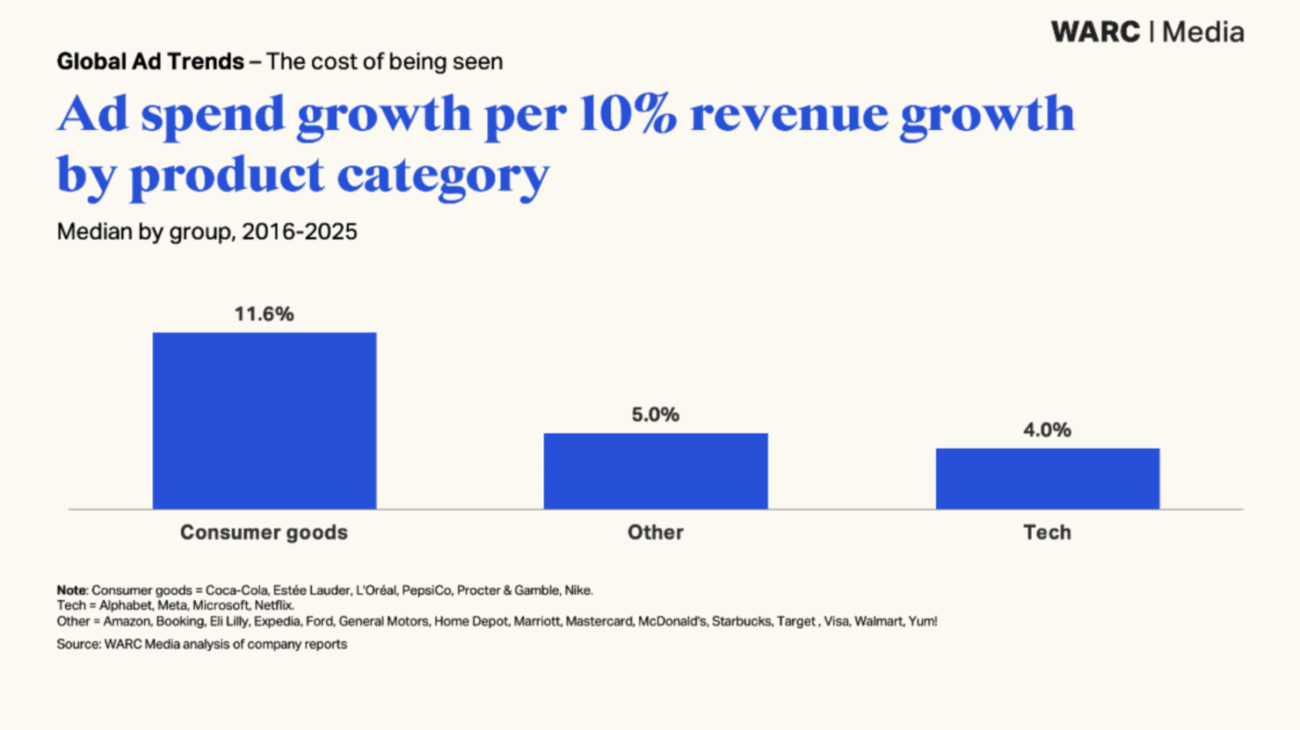
Ad spending by global brands is growing more slowly than their revenue. This is according to the report «Global Ad Trends: The Cost of Being Seen» by WARC Media. The study examines how advertising intensity has changed among 25 of the largest advertisers and to what extent major brand owners are driving the growth of the global advertising market. Consumer goods manufacturers are an exception to this trend.
Advertising Expenditures by Global Brands: Share of Revenue Declines
WARC Media forecasts that global advertising spending will grow by 11.9 percent this year to 1.34 trillion U.S. dollars. Adjusted for inflation, this represents a 61.3 percent increase over 25 years, driven by new channels such as retail media and platform advertising. However, advertising intensity has declined in recent years.
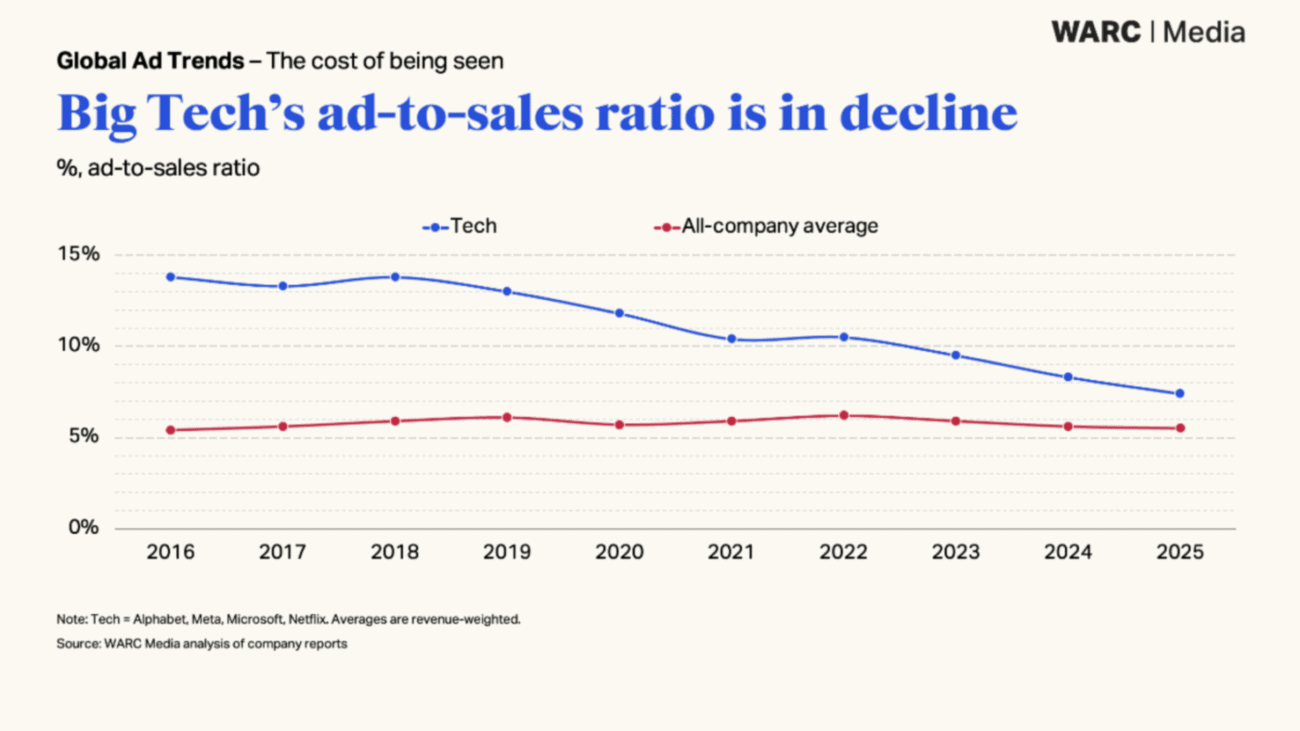
Among 25 major U.S. advertisers, the combined ratio of advertising spending to revenue fell from 6.1 percent in 2019 to 5.5 percent in 2025. This does not mean a retreat from advertising: Advertising spending rose by a combined 56 percent, while revenue rose by 73 percent.
Big Tech is driving down the rating
For Alphabet, Meta, Microsoft, and Netflix, the combined ratio fell from 13.0 to 7.4 percent between 2019 and 2025. Their combined revenue grew by 146 percent, from $379 billion to $931 billion. If the companies had maintained their 2019 spending rate, they would have invested $121 billion in 2025, according to WARC—$52 billion more than they actually did.
The consumer goods industry is taking the opposite approach
The six consumer goods brands analyzed—Coca-Cola, Estée Lauder, L’Oréal, Nike, PepsiCo, and Procter & Gamble—showed divergent trends. Five of them increased their ratio between 2019 and 2025, while PepsiCo’s remained largely stable. Due to weaker revenue growth, the combined ratio rose from 11.6 percent in 2023 to 12.5 percent in 2025. Their advertising spending grew by 36 percent from 2019 to 2025, while revenue grew by 29 percent.
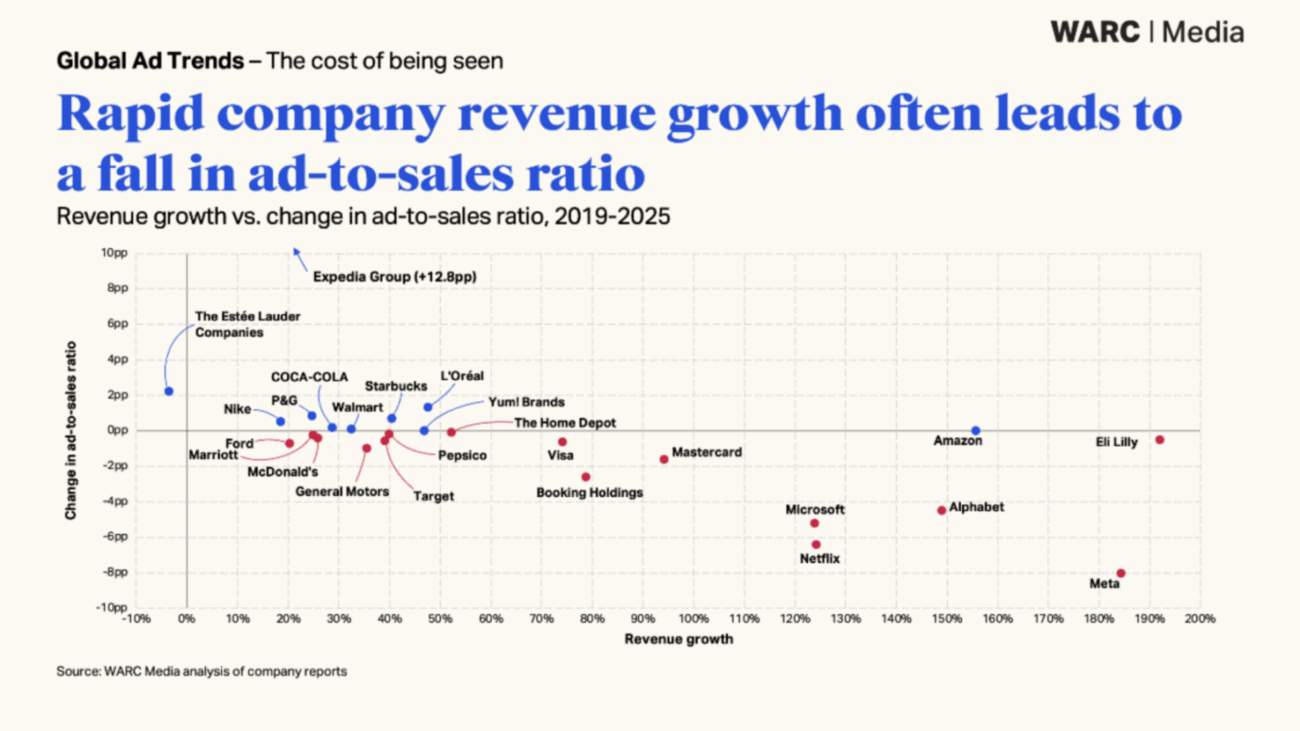
The picture is mixed for the remaining 15 advertisers. The revenue-weighted average remained the same or rose slightly, but ten companies saw their share decline. Ford fell from 2.3 to 1.6 percent, General Motors from 2.7 to 1.7 percent, Visa from 4.8 to 4.2 percent, Mastercard from 5.6 to 4.0 percent, McDonald’s from 1.7 to 1.3 percent, and Target from 2.0 to 1.4 percent. Marriott, Booking Holdings, Eli Lilly, and The Home Depot also saw declines. Amazon and Yum! Brands remained largely unchanged, while Walmart, Starbucks, and Expedia saw their shares rise.
Three Factors Behind the Divide
WARC identifies three factors that influence advertising intensity. First, weak sales: Companies that maintain their advertising spending during difficult market conditions may see an increase in advertising intensity. Second, budget shifts: Funds that used to be allocated to sales teams for trade and shopper marketing are now flowing into retail media and, consequently, into advertising placements. Third, ownership of attention: Companies like Alphabet and Meta own an audience and can grow without having to pay for attention.
Alex Brownsell, Head of Content at WARC Media, says: «The global advertising market is growing rapidly, yet companies ranging from Meta to Mastercard and McDonald’s are spending a shrinking share of their revenue on advertising.» Only consumer goods companies, which were suffering from slowing revenue growth and saw their trade budgets shift to measured media, increased their advertising intensity. The expansion of platform spending by smaller companies and cross-border e-commerce providers is far outpacing the growth in advertising investment by major brands. This has major implications for the ecosystem of agencies and service providers in the enterprise market.
Methodology
WARC analyzed annual SEC filings from 25 large publicly traded U.S. companies. The ratio is calculated by dividing annual advertising spending by revenue and multiplying by 100. Since some companies report only combined sales and marketing expenditures, WARC supplemented the data with industry figures from Schonfeld & Associates and its own ROI benchmarks. WARC Media subscribers can read the full report. A podcast discussing the findings is scheduled to be available starting November 17.