Slight decline in e-commerce advertising pressure in September
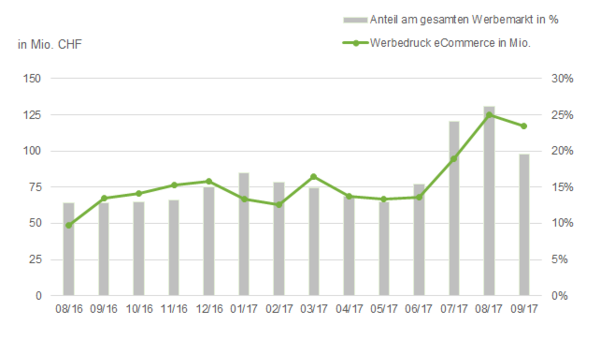
The first month of fall this year saw total e-commerce advertising spending of 117.5 million Swiss francs (gross). This represents a 6.2 percent decline compared to the previous month. «Travel» remains the strongest market category.


However, compared to the previous year's figure (67.2 million), advertising print recorded an increase of 74.8 percent in September 2017. The e-commerce share of the overall market amounts to 19.6 percent.
Search advertising: Mobile data integration
The Internet media group has been reported including search advertising since January 2017. The media mix is published monthly in the advertising market trend. Search advertising includes data on Search Desktop. As of the end of July 2017, Search Mobile is also integrated and reported in the advertising statistics of Media Focus in addition to Search Desktop.
Total market
Development of e-commerce advertising print as of September 2017
The travel fever continues
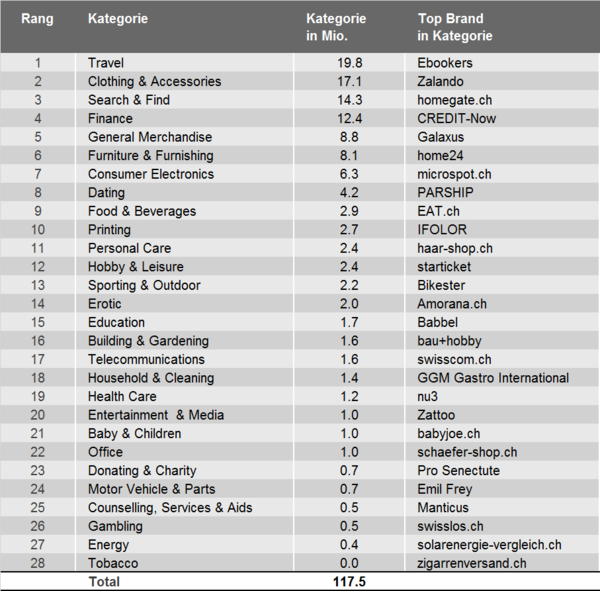
Although the Travel category has reduced its advertising pressure by around 20 percent compared to the previous month, it is still clearly in 1st place. Within the market category, Ebookers has replaced its competitor Trivago as the top brand. Clothing & Accessories gains again in the fall, defending 2nd place. In this category, Zalando continues to hold on to the top spot. In 3rd place, as in the previous month, is the Search & Find market category. This month, however, homegate.ch is able to displace the competing platform ImmoScout24 from the top position.
Market categories
Monthly e-commerce advertising print and top brand
More space for classic media
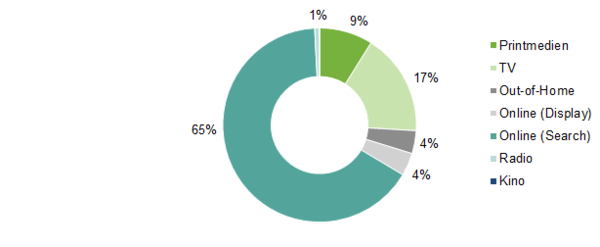
E-commerce brands continue to rely on the dual strategy of online (search) and TV. However, search advertising is declining compared with the previous month, while more advertising pressure is flowing into traditional channels, especially TV. As a result, the share of search advertising is down significantly compared with August (-16 percentage points) and is being redistributed. The biggest gains are in the TV (+7 percentage points) and out-of-home (+3 percentage points) media groups.
Media Mix
Advertising print distribution of all e-commerce brands in September 2017
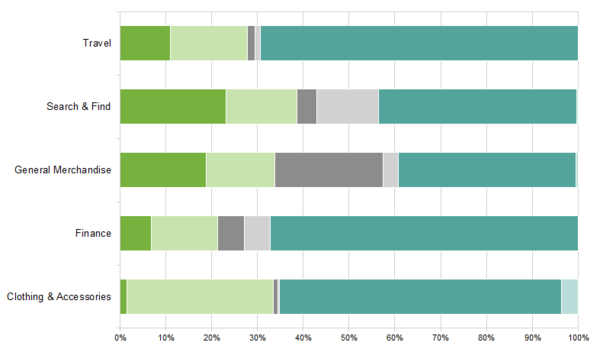
Advertising print distribution of the top 5 categories
The competition increases
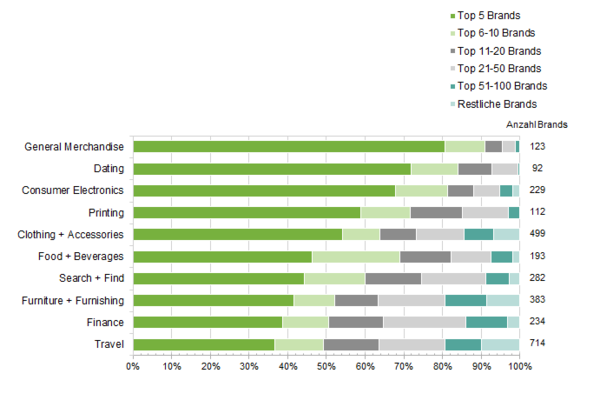
Although the top categories are still the same as in August, more and more brands want a piece of the e-commerce pie. The number of competitors within the top 10 market categories has again increased by 39 brands.
In the Finance market category, 13 more brands placed ads in September than in August, and Travel also gained another 11 brands. Search & Find recorded an increase of 10 brands and Clothing & Accessories 8 brands. Only the Dating market category recorded a notable loss of 11 brands. This corresponds to around one tenth of the market participants in this category.
Top 10 categories
Advertising shares of e-commerce brands in September 2017