The big June hole in Swiss advertising print failed to materialize this year
In June, the month of the World Cup, Credit Suisse's TV sponsorship of the Swiss national team and the gambling law campaigns, among other things, ensured stable advertising pressure.


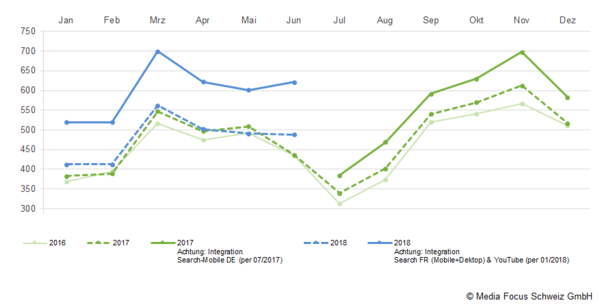
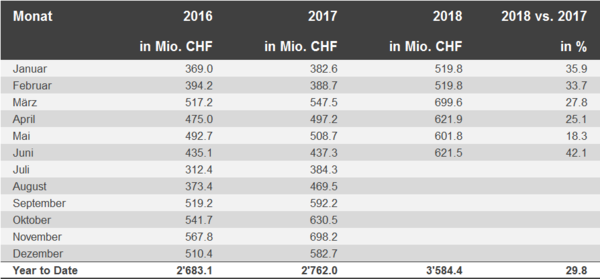
Following the slight decline in the previous month, advertising pressure returned to the April level with an increase of 3.3% to 621.5 million gross francs. Unlike in previous years, there was no marked decline in advertising pressure in June. However, the increase is mainly due to the data expansion*. But even without this, advertising pressure fell only minimally by 0.6%.
The first half of the year therefore closed with a gross figure of CHF 3,584 million and a significant increase of 29.8% - excluding the online data expansion, advertising pressure amounted to CHF 2,868 million, which corresponds to an increase of 3.8%.
Advertising pressure in the overall market
Development of advertising pressure as at June 2018
Finances at a World Cup high
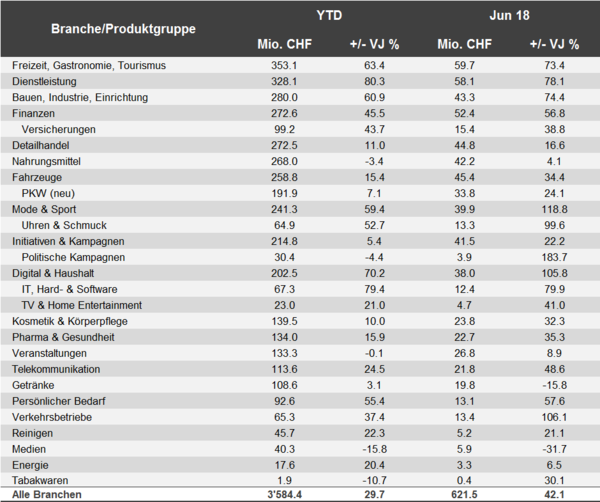
The financial sector climbed another two places in the YTD sector ranking, boosted by Credit Suisse's TV sponsorship of the Swiss national team, among other things. This leaves the retail trade (-5.0%) and food (-22.1%) sectors behind, both of which have taken some pressure off the gas pedal compared to the previous month. Otherwise, the ranking remains unchanged. The top sectors of leisure, gastronomy, tourism and services even extended their clear lead with 8 million more gross value added each compared to the previous month.
Gambling law lets the advertising hubs roll
Compared to the previous year, the Political Campaigns product group increased its advertising pressure significantly by 183.7%. The campaign on the Gambling Act is a key driver here. The fashion & sports sector, with online retailers Zalando and Co., also saw a doubling of gross advertising pressure (+118.8%).
Compared to the previous month, tobacco products (+275.9%), IT, hardware & software (+45.0%) and transportation companies (+36.4%) achieved the highest increase.
Media and beverages can't keep up
Only two sectors recorded less advertising pressure compared to the same month last year. One of these is the media sector. With 31.7% less advertising pressure compared to the same month of the previous year, it recorded the highest decline in a sector comparison. The beverage industry also significantly reduced its advertising pressure by 15.8%, despite the summer temperatures.
Advertising printing in the industries
Advertising pressure in the sectors with year-on-year comparison
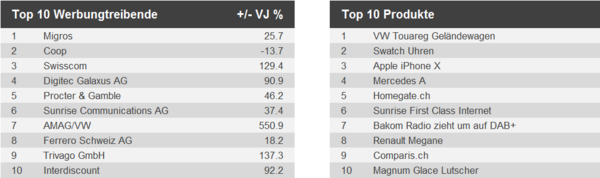
Top 10 of the month
The top advertisers and most advertised products and services (excluding product range and image advertising) in June
Media Mix
The integration of Search (January 2017) and Mobile (July 2017) data into the Media Focus advertising statistics has led to a significant increase in the share of Internet in the media mix. Since January 2018, Search data has also been collected for French-speaking Switzerland (Search share: 87 percent DE/13 percent FR).
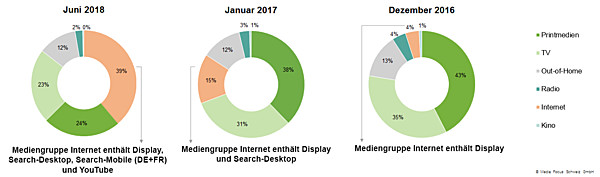
*Data integration: Internet and TV
The Internet media group has been reported in the Trend advertising market since January 2017, including search desktop advertising. Search Mobile was also integrated into the Media Focus advertising statistics as of the July 2017 data cut-off date. In January 2018, Search was integrated for French-speaking Switzerland on the basis of tens of thousands of French search terms (share of Search YTD: 87% DE/13% FR).
Since March 2018, YouTube data (display and video) has also been reported retroactively from January 2018 in the advertising market trend (share of media mix YTD 1%).
From January 2018, the TV media group will also include TV sponsorship and the pre-split, post-split, single split and time advertising formats.
New: Integration YouTube data
The Internet media group now also includes data for YouTube (video pre-rolls and display). These were integrated retroactively from January 2018. In March, YouTube accounted for 3 percent of the Internet media group and 1 percent of the media mix. More than 600 advertisers, led by Apple, Swisscom and Wix.com, use the channel to reach their target groups.
Information about YouTube (WMT):
Improvements in the query based on customer feedback have led to adjustments in the evaluation. Comparability over a defined time series is still guaranteed at all times. Currently, lifestyle/tech brands still tend to be overrated on videos with extremely high reach (e.g. Apple). In order to reflect reality as closely as possible and to do justice to these extreme cases, we will constantly optimize the valuation. There may therefore be further adjustments to the rating method in the near future.