Strong advertising month in January followed by a damper in February
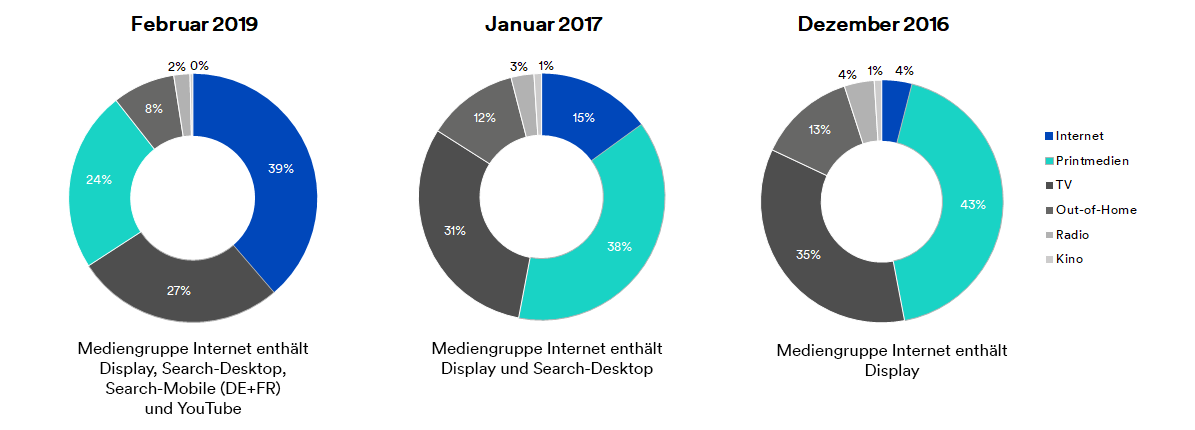
Gross advertising pressure amounted to CHF 471.5 million in February and was therefore significantly lower (-19.7%) than in the first month of 2019. Compared to the same month last year, advertising pressure also fell by 9.1%.


A closer look at the sectors shows that almost all sectors have reduced their advertising pressure compared to February 2018. After two months, annual advertising pressure stands at CHF 1,059 million and is therefore still on course for growth compared to 2018, up 2.1%.
Advertising pressure in the overall market
Development of advertising pressure as at February 2019
No changes in the industry ranking
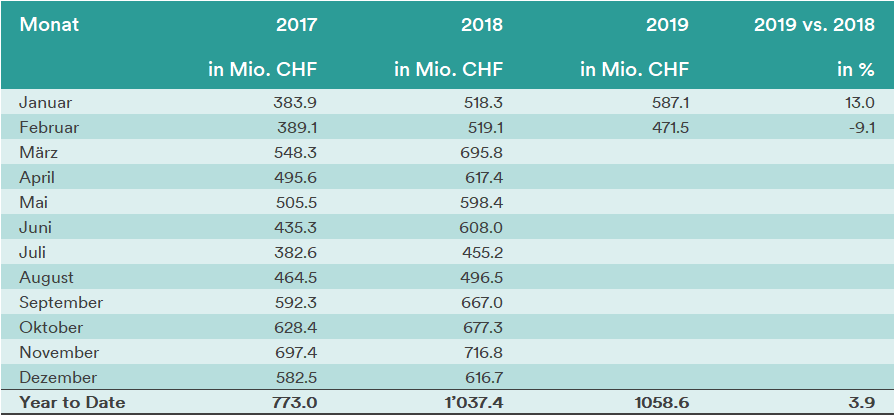
In a sector comparison, little has changed compared to the previous month of January. Leisure, gastronomy & tourism remain lonely at the top, followed by the service and vehicle sectors. The only shake-ups are at the bottom of the ranking, where Cosmetics & Personal Care, Events and Personal Supplies swap places.
Tendency towards lower advertising pressure - with some exceptions
Compared to the same month last year, gross advertising pressure has decreased in the vast majority of sectors. One of the major outliers was the TV & Home Entertainment product group (+76.2% year-on-year). This group of surprising winners also includes the tobacco industry, which increased its advertising pressure by an impressive 209.3% compared to the same month last year. However, this effort by the tobacco industry is not enough to get rid of the red lantern. The energy sector increased its advertising pressure by 13.5% compared to February 2018.
Initiatives and campaigns with the sharpest decline
Initiatives and campaigns (-26.2%), including the political campaigns product group (-53%), recorded the sharpest year-on-year decline in advertising pressure. This can be explained by the "No Billag" popular initiative of March 4, 2018, which was heavily discussed and advertised at the beginning of last year. The beverage industry, which reduced advertising pressure by 25.6% compared to February 2018, and the food industry (-22.5%) also suffered significant losses. The retail trade (-18.5%) and transport companies (-18%) also saw a clear reduction in gross advertising pressure compared to the same month last year.
Advertising printing in the industries
Advertising pressure in the sectors with year-on-year comparison
Top 10 of the month
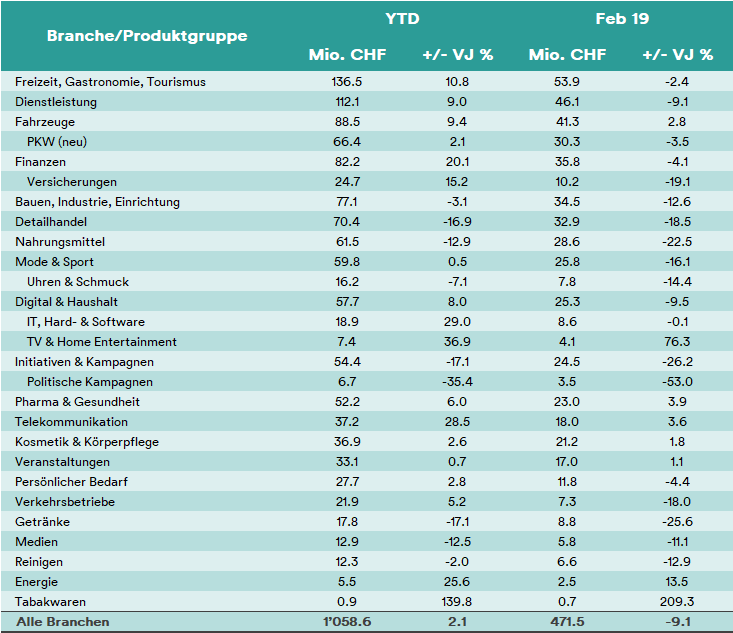
The top 10 advertisers and most frequently advertised products and services (excluding product range and image advertising) in February
Media Mix
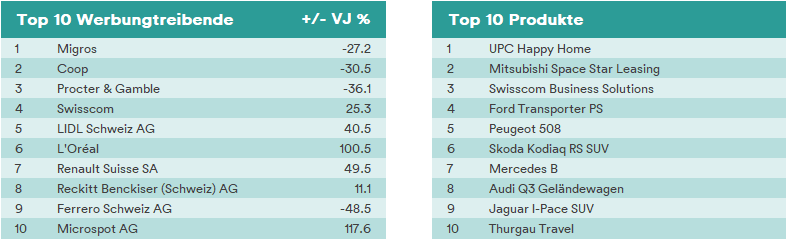
The integration of search data, desktop (January 2017) and mobile (July 2017) into Media Focus's advertising statistics has led to a significant increase in the internet's share of the media mix. Since January 2018, search data has also been collected for French-speaking Switzerland (share of search: 85% DE/15% FR).