E-commerce advertising pressure April: Weaker than in March, stronger than a year earlier
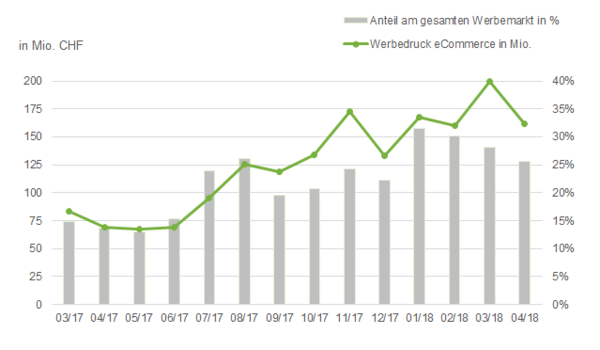
Following the peak in March, e-commerce advertising spending eased slightly again in April. E-commerce advertising spending totaled 161.8 million Swiss francs.


This corresponds to a decline of 18.9% compared to the previous month of March and an e-commerce share of 25.7% of the total advertising market. A comparison with the same month last year continues to show significant growth - both with (+132.9%) and without online data expansion (+19.0%).
Data integration: Internet and TV
The Internet media group has been reported including search advertising since January 2017. The media mix is published monthly in the advertising market trend. Search advertising includes data on Search Desktop. As of the end of July 2017, Search Mobile is also integrated and reported in the advertising statistics of Media Focus in addition to Search Desktop. Since January 2018, Search data has also been collected for French-speaking Switzerland on the basis of tens of thousands of French search terms (Search share: 87% DE/13% FR).
YouTube data integration
Since March 2018, the Internet media group has also included data for YouTube (video pre-rolls and display). These were integrated retroactively from January 2018. The share of the e-commerce media mix is 1 percent.
In addition, the TV media group will be reported including TV sponsorship and the advertising formats pre-split, post-split, single split and time from January 2018.
Total market
Development of e-commerce advertising pressure as at April 2018
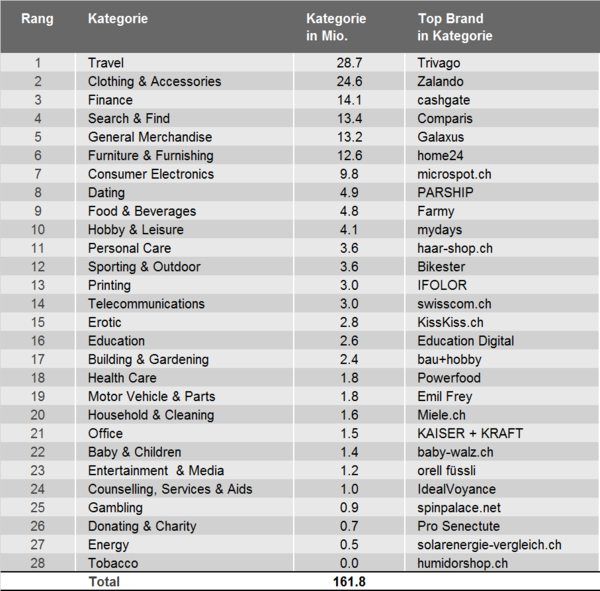
Finance, General Merchandise and Food-Beverages make up places
April sees a real swing in the market category rankings. Although the top spots remain the same with Travel and Clothing & Accessories, the top brand in Travel changes. Ebookers was only able to stay at the top for one month, as Trivago regained the title of Top Brand in April. There was also movement on the bronze podium. Finance gained another place and ousted Search & Find from third place. General Merchandise was the only one of the top market categories to increase its advertising pressure in the rather weaker month of April compared to the previous month and now occupies fifth place. For Furniture & Furnishing, this means a loss of position for the second time in a row. Food & Beverages also benefited from the significant decline in advertising pressure in the other sectors and climbed from 10th to 9th place.
Market categories
Monthly e-commerce advertising print and top brands
TV and OOH share increases minimally at the expense of online (search)
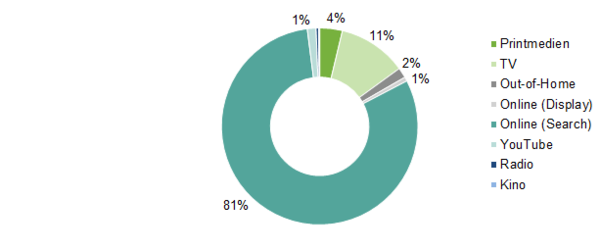
Online (search) remains clearly the strongest media group with 81%. TV, the second strongest channel, gained one percentage point in April, as did OOH advertising. The gains were made at the expense of online (search). Consequently, there were no changes in the remaining media groups.
Media Mix
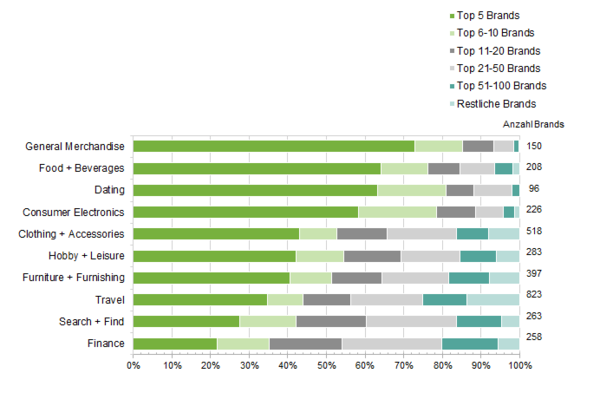
Advertising pressure distribution of all e-commerce brands in April 2018
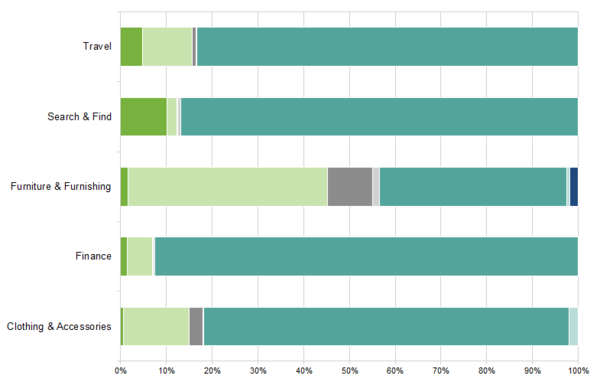
Advertising print distribution of the top 5 categories
Fewer brands again in April
In April, the top 10 e-commerce market categories recorded 58 fewer brands than in April. In particular, Furniture & Furnishing (-20), Travel (-18), Hobby & Leisure (-14) and Clothing & Accessories (-10) have fewer brands. Only Finance (+7), Dating (+3) and General Merchandise (+1) recorded more brands in the current month.
Top 10 categories
Advertising shares of e-commerce brands in April 2018