Advertising market trend February 2018: Advertising pressure at previous month's level
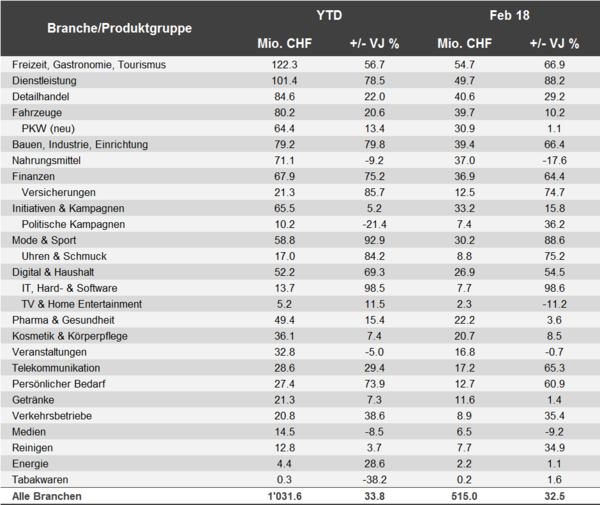
The main drivers of growth in the Swiss advertising market in February were the leisure, food service, tourism, and retail sectors.


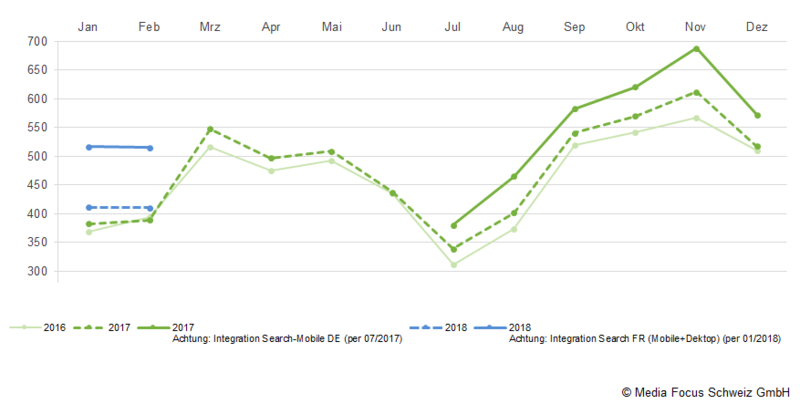
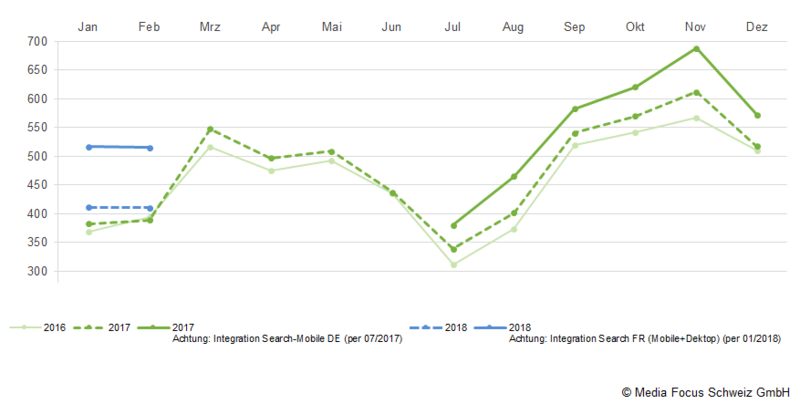
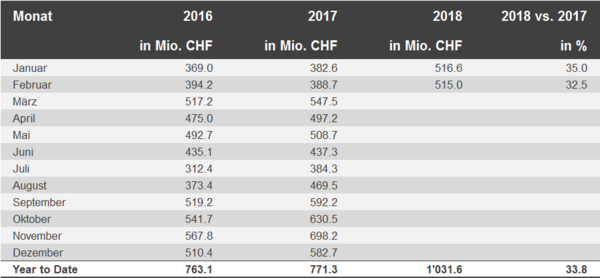
With advertising print of 515 million gross advertising francs in February 2018, the Swiss advertising market is on a par with the previous month. Compared to 2017, this represents an unadjusted increase of around one-third (33.8 percent) - but even without the expansion of search data coverage, growth in the Swiss advertising market is 6.6 percent. The main growth drivers are the leisure, hospitality, tourism and retail sectors. The first two months of 2018 together show an advertising print of 1,031.6 million gross Swiss francs (without data extension search: 822.1 MCHF).
Data integration: Internet and TV
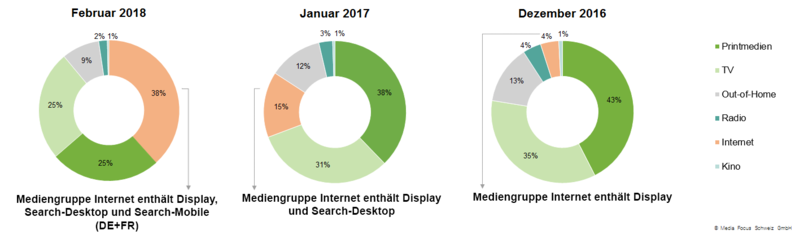
The Internet media group has been reported including search advertising since January 2017. The media mix is published monthly in the advertising market trend. Search advertising includes data on Search Desktop. As of the end of July 2017, Search Mobile is also integrated and reported in the advertising statistics of Media Focus in addition to Search Desktop. Since January 2018, Search data for French-speaking Switzerland has also been collected on the basis of tens of thousands of French search terms (share of Search YTD: 87 percent DE/13 percent FR). In addition, as of January 2018, the TV media group is reported including TV sponsorship and the advertising formats pre-split, post-split, single split and time.
Advertising pressure in the overall market
Development of advertising print as of February 2018
Leisure, gastronomy and tourism expands leadership
In February, the Leisure, Catering & Tourism industry outperformed the second-placed Service industry even further. This is particularly remarkable when one considers the fact that Leisure, Hospitality, Tourism reduced advertising pressure by over a quarter (-28 percent) compared to January 2018 and that Services, after Fashion & Sports, is the sector with the highest year-on-year growth. Retail trade, vehicles and construction, industry and furnishings follow unchanged on the ranks 3 to 5.
The voting campaign revives Political campaigns
In February, the political campaigns product group posted its first increase in 6 months, with a significant rise of 36.2 percent to 7.4 million Swiss francs. This is due in particular to the commitment of opponents of the No Billag campaign.
Food during Lent
The food industry significantly reduced its advertising print by 17.6 percent compared with the previous year. This corresponds to an absolute decrease of 7.9 million gross Swiss francs. After the high phase in December and January, the TV & Home Entertainment product group slowed down again in February. Compared to the previous year, it reduced even more significantly by minus 11.2 percent. Media also lost advertising pressure again (-9.2 percent). This makes the sector one of the losers for the third time in a row.
Advertising printing in the industries
Advertising pressure in the sectors with year-on-year comparison.
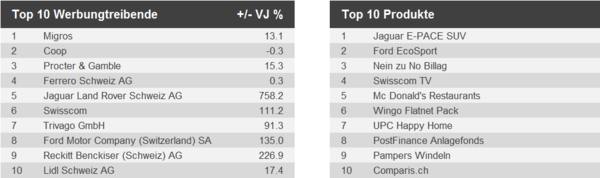
Top 10 of the month
The top advertisers and most advertised products and services (excluding assortment and image advertising) in February.
Media Mix
The integration of Search (January 2017) and Mobile (July 2017) data into the Media Focus advertising statistics has led to a significant increase in the share of Internet in the media mix. Since January 2018, Search data has also been collected for French-speaking Switzerland (Search share: 87 percent DE/13 percent FR).