Infographic on the naturalization issue
YAAY, an information design agency, has created an infographic on the topic of naturalization based on its own research.


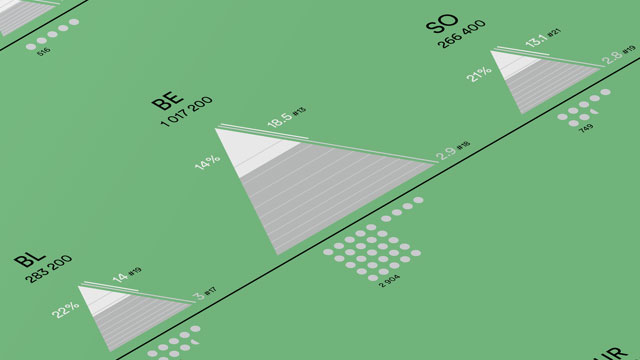
The infographic is the first journalistic project initiated by YAAY itself. The information graphic visualizes the cantonal comparison on the topic of Swiss naturalizations in 2015. The overview presents two very different ways of looking at the key figures. On the one hand, the number of naturalizations per 1000 inhabitants in the canton (general number of naturalizations) and the not so widespread number of naturalizations per 1000 foreigners, with permanent residence in the canton. This results in two very different views on the subject.
How the infographic was created
Each canton is represented by a triangle and shows various key figures on naturalization. The white tip represents the foreign resident population in percent. The gray area of the triangle marks the number of Swiss residents in percent. In addition, the triangles are sorted by the number of naturalizations per 1000 inhabitants. If the triangles are sorted according to the number of naturalizations per 1000 foreigners, the order changes. In addition, there is the Swiss map with the cantons in the upper right corner for a geographical overview. The representation of the cantons in triangles shows that it makes a big difference whether one looks at the number of naturalizations per 1000 inhabitants or the number of naturalizations per 1000 foreigners.
For example, Basel-Stadt granted a total of 1025 citizenships (gray dots) in 2015. Measured against its population of 191,800, Basel-Stadt ranks sixth out of a total of 26 in a cantonal comparison. By contrast, if the number of naturalizations is considered in relation to the number of foreigners, the canton falls to 18th place.